
Share
SPEAKERS:
- Graham DeAth, Programme Director, The Healthy Homes Project
- Paul Ruyssevelt, Professor of Energy and Building Performance, UCL Energy Institute, Building Stock Lab
- Sam Guiver, Network Assurance Manager, Suffolk County Council
Recordings of the 2024 conference talks can be found here
New operating model - 'new blueprint'
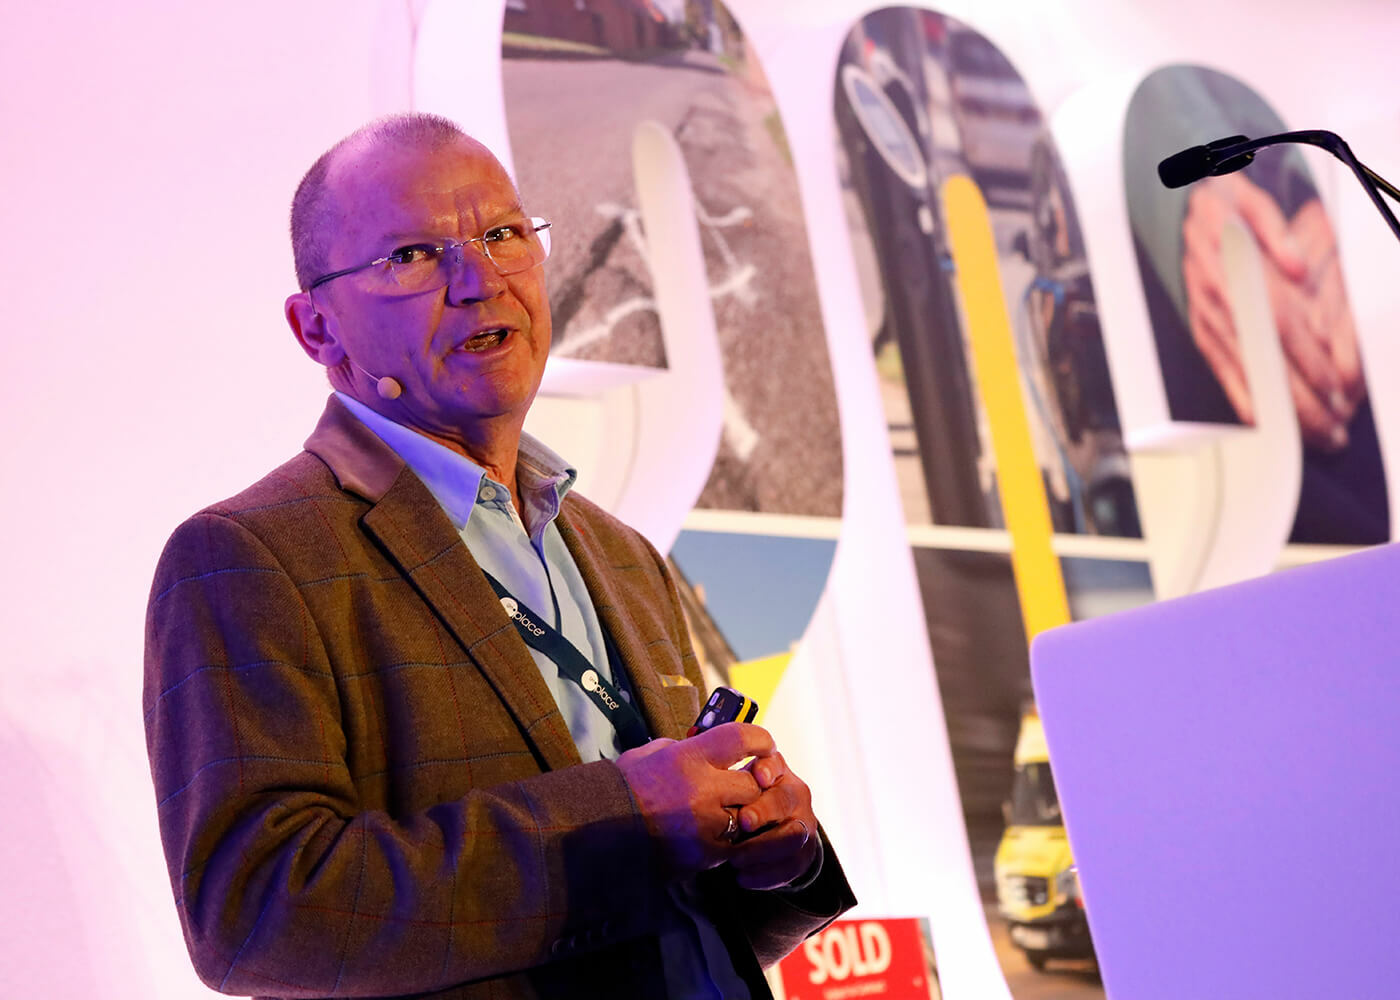
Graham DeAth engaged the audience with a talk on the Healthy Homes Project, focused on using geospatial data with health and personal data.
As of 1st July, 2023, England's health and wellbeing is now the responsibility of integrated care systems. New organisations, born out of the NHS, but encompassing public health as well - a whole health and wellbeing agenda. These are integrated care systems. They require an alternative approach to innovation, and way in which the sector might apply or explore the application of what is referred to as systems thinking. Looking at the way organisations are joined up or not joined up, both internally but also with organisations within which they work.
This is where the Healthy Homes project was seeded. It's a small project, concerning 27 million homes in total, 3.8 million private rented homes, and - as an initial focus - 4.4 million social housing providers. A very simple challenge statement was created: understand environmental problems from a social housing provider's view, managing the condition of homes and ensuring those conditions keep the occupants of those homes healthy and well (a named individual within a social housing provider is now legally responsible for the health and well-being of their tenants).
The project recognises the multiplicity of stakeholders involved in this. There is a need for more collaboration, more stakeholder involvement, more 'dot joining' in general. Healthy Homes focuses on the application of systems thinking - taking on the integrated challenges of understanding the home, the home condition, and the health of the occupants of that home. It starts with recognition there are two systems coexisting in this space. A housing system and a welfare system.
The variables multiply quickly. Someone acts as a key holder of a social housing provider, paying rent. There's a compliance program, checking the social housing provider; there's maintenance - preventative maintenance, and restorative maintenance. There's a system in which a social housing provider operates to ensure it is doing what it should be doing.
Similarly on the health side, if someone has a medical need then they might be bed-bound; they might be under a GP, they might end up in hospital. Again, there's a subsystem. It isn't just about health in terms of patients in hospital - it's health through multiple domains. It's already often cited that people spend up to 85% of their time in their own home. If they're ill or in need, that figure is likely to be higher. The impact of the home on their health becomes critical. Informal social care has a part to play, too. Friends and family, for example, looking after each other, or unpaid carers that have immense value to society.
These two systems must coexist. The question arises, "How does a social housing provider look after their housing while being responsible for the health of their occupants." Similarly, under the new ICS structure, a health system must look after the health and well-being of their own community, including people occupied in those homes that are part of the ICS construct. This is where technology has a role to play.
People are used to having more technology in the home now, supporting social housing providers to better manage the fabric condition of their homes. As a potential point of integration between two systems, technology has a huge part to play, and this level of integration is referred to as 'a new blueprint'. These two systems can operate together as one to deliver better health outcomes to the occupants of (initially), social housing providers but hopefully to all housing, eventually.
As an illustration, in Liverpool, air quality meters were installed in a project supporting children with respiratory illnesses. These devices monitored the air quality in the pilot occupants' homes. If it was detected that there was an issue with the air quality, somebody would call the occupant, talk them through what was going on and try and correct what was causing that poor air quality. There are many of these systems that come under the banner of 'activities of daily living'. In short, these are discrete sensors deployed around a home. tracking what an individual is doing in their own home from day to day, from hour to hour.
The sensors learn. They learn what the normal pattern of behaviour is, so that if something happens that indicates there may be an issue - such as a kettle not being switched on within a certain timeframe - it can potentially alert friends and family or a care provider.
To better understand and optimise these two systems, the UPRN is essential. It enables what is potentially a huge data set in a way that facilitates exploration in depth - analysis that allows teams to understand how housing affects health.
The Healthy Homes project creates an environment in which stakeholders can have a conversation about what the benefits of understanding that relationship might be. From environmental factors affecting homes to the big picture - climate change and global change. Local effects of flooding, for example. Again, change over time. The third dynamic that affects the home is occupant behaviour. That poor air quality example is particularly relevant with the cost-of-living crisis, and people not being able to heat their homes - situations that are much better understood, and challenges overcome, through the use of location data.
Building stock tools
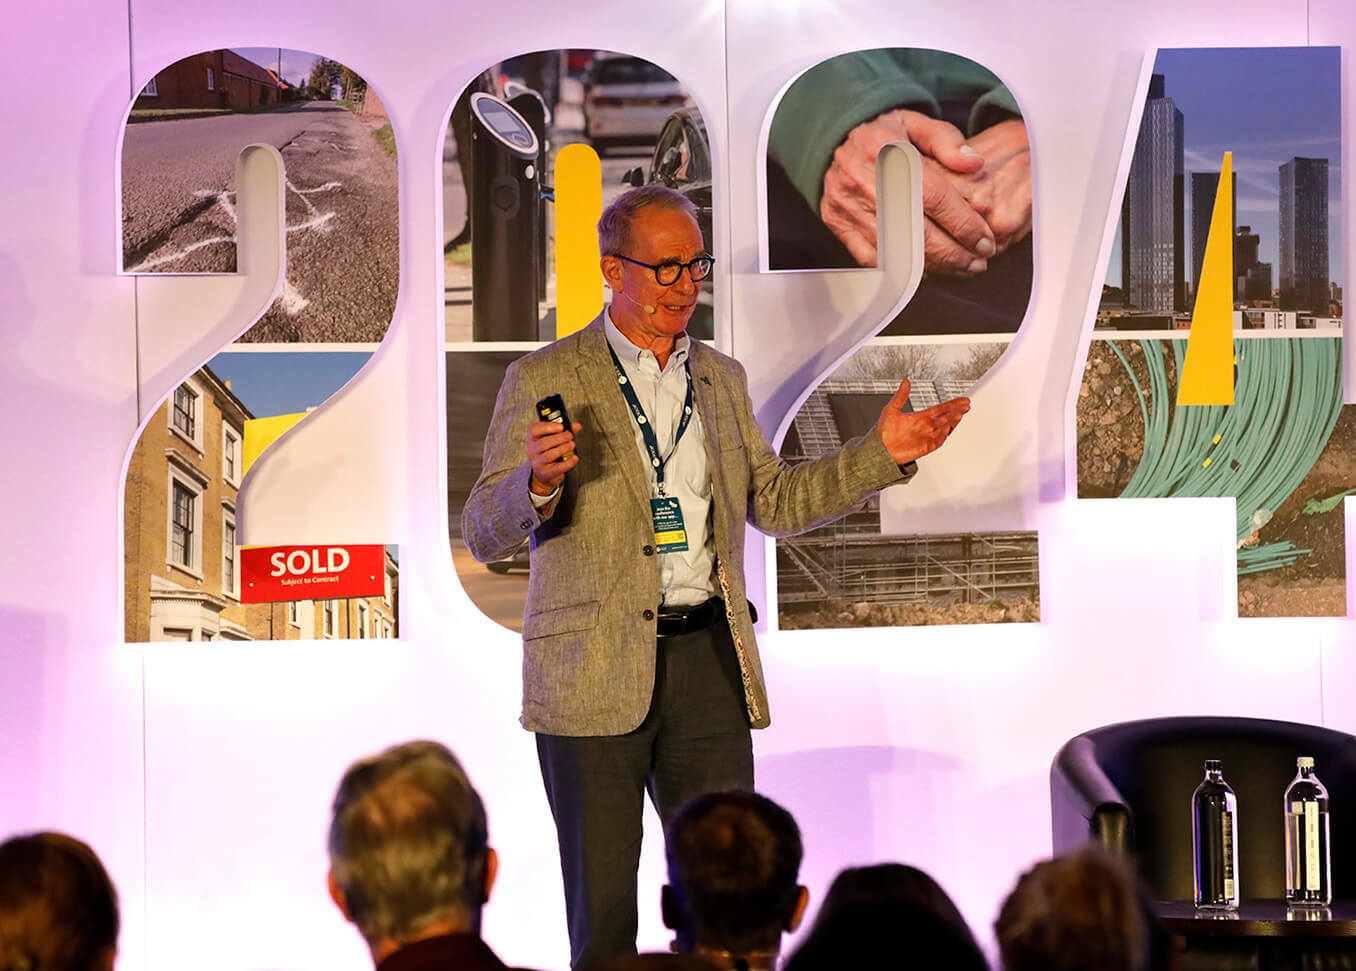
As the Professor of Energy and Building Performance at University College London, Paul Roosevelt runs the Building Stock Lab (BSL). In today's situation, Paul explained the purpose of two projects being run by the BSL: the National Buildings Database, and the Overheating Risk Maps for England and Wales. Both draw on data being ingested by central geospatial systems - location data is pivotal to their success.
To explain the National Buildings Database, Paul used the example of utilities and transport infrastructure. The railways are worth some £300 billion to the economy, they are run by 28 organisations, and emit 2.3 million tonnes of carbon dioxide. The water industry is a £90 billion asset, run by 11 companies emitting 2.5 million tonnes of carbon dioxide. Electricity industry; £196 billion, 37 companies. Much harder to establish how much COs they emit, as this devolves its products to buildings and people's services. But according to Savills, that underlying estate has a value of £8.7 trillion - 23 million individual stakeholders, if social landlords and private owners and so forth are taken into account. In short, 32 million units, £10 trillion, 24 million owners, with more diverse, more valuable, more owners.
UK buildings need a digital twin and so BSL was been commissioned by the Department of Energy, Security and Net Zero to build a National Buildings Database.
Its primary interest is to do with energy use and carbon emissions. But those actually sit at the heart of a number of government departments sharing this information, and ultimately the database will be available to other government departments as well. The work builds on around about 10 years of previous endeavour, producing information on building stock and bringing various data sets together.
'3D Stock' is now used in a number of applications. The London Building Stock Map pulls together all of the buildings in London and joins a whole series of data sets for the GLA. On top of that, is something called the London Solar Opportunity Map, which looks in a great deal of detail at all of the roof spaces and spaces surrounding buildings and understands what the solar potential might be if harvested through different technologies.
Local authorities can use this to help them understand the energy performance of their social housing and automatically assess the he retrofit options that could be undertaken. The purpose of this project is to create a record of every single building in Great Britain (the data sets are yet to be acquired for Northern Ireland).
This will characterise every single building in terms of their floor space, energy data, construction materials and so forth. In particular, one of the interests is energy performance. Certificates are available for roughly 50% of properties, but it is uncertain how accurate they are, or how useful they are. This system will compare theoretical calculations and the actual performance in practice.
Outputs should be available for consumption by a series of researchers, local authorities and others - without needing to disclose the underlying confidential data. The database is constructed primarily from publicly available datasets. This is the basis of the 3D stock model. It involves several Ordnance Survey products, together with Land Registry data, and data from the Valuation Office Agency (detailing floor space on a floor-by-floor level and breaking that down into different categories of use). It also pulls in data from current energy performance certificates and display certificates.
The team has managed to connect all of the input data defining what type of heating systems are installed, how much window area there is and so forth. Through a confidential arrangement with the Department of Energy, metadata has been ingested from the energy supply companies, too.
The three-dimensional element of the system is built using LiDAR from the Environment Agency - resolving their point cloud, turning it into three-dimensional forms that can be superimposed on polygons. Also, through this project, BSL is carrying out a series of surveys to check data accuracy, and to understand how people are using energy.
Some quick findings from the first phase of the project, finished in 2023, show a significant number of premises might benefit from improvements to their environmental credential but these also have heritage status. That has an immediate impact on the potential for retrofitting those properties. 94% of the premises in Great Britain are less than thousand square meters but conversely 10% of the premises occupy 60% of the floor space.
Understanding that relationship allows government to decide where to prioritise activities. Prior to this project, the best estimate of hospitality floor space was the Building Energy Efficiency Survey undertaken in 2014, which estimated about 50 million square metres of floor space. Through the methods used by BSL, it's been possible to identify another 10 million square metres of floor space that makes a considerable difference.
For many years the government has treated non-domestic stock and domestic stock separately, using archetype models. This project has demonstrated the extent to which the stock is really mixed. 48% of non-domestic buildings will share a building or premises will share a building with a non-domestic building and 23% of those will share a building with domestic. Again, that has implications for to retrofit and move towards zero carbon.
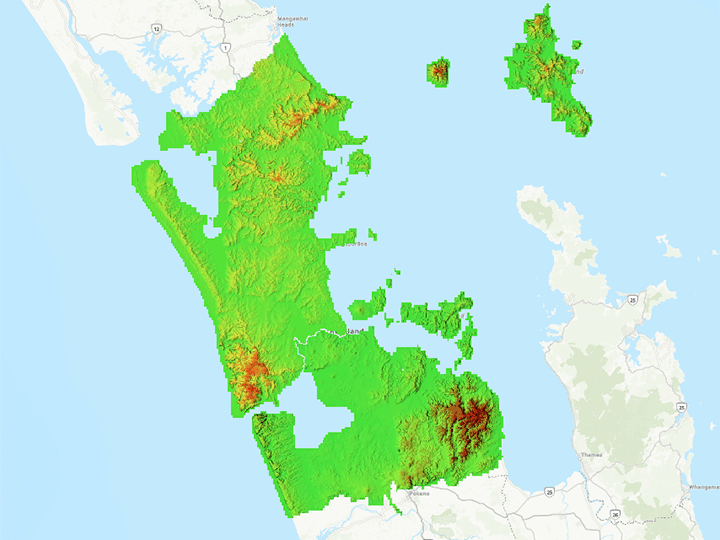
The second project which is the mapping of overheating risk. This came about through a commission from DESNEZ (Department of Energy Security and Net Zero), and it particularly looks at climate impact. Colleagues in a sister department to the BSL undertook an analysis of the risk of overheating under different climate scenarios in the future across all housing in the UK.
That report will be available soon. But the aim was to represent that at a national level. This involved developing a tool that looks at the overheating risk (modelled just for England and Wales at the moment). This was built on top of the 3D stock model, which takes it down to the individual property level, houses, apartments and so forth. It looks at the risk of future overheating at an individual property level. It also examines different climate scenarios.
A further tool will be launched through the DEFRA data services portal. This allows users to search for different properties, zoom in at different levels, and display the keys for different metrics. BSL has looked at different ways of measuring overheating, as there are different systems. Hours over 26 degrees at night, for example, which makes it hard to sleep. That has a significant impact on health. This has enabled BSL to produce a social vulnerability index.
By overlaying the vulnerability index with the overheating risk analysis, local authorities can very quickly identify those areas that they should perhaps focus more attention on, for retrofitting climate adaptations. The model factors in scenarios that show what would happen the homes are, for example, better insulated or window-blinds or shutters are installed. A range of different metrics is included (overheating to 26 degrees is just one), and these can be broken down into individual house types within any areas.
Views can be saved, stored, and reviewed later, simply using a URL. The underlying data can be exported via an API into GIS systems, too - the aspiration is for go-live in late 2024.
Driving healthy communities: alleviating congestion and minimising disruption caused by street and road works
Sam Guiver is the Joint Authority Group (JAG UK) Vice Chair, representing a huge number of highways colleagues and also the Network Assurance Manager, Suffolk County Council. His presentation set out his authority’s work on tackling congestion.

Congestion impacts the travelling public. All local authorities have a duty to coordinate and consider the overall highway network to ensure, as far as reasonably possible, as well as other obligations, that an expeditious movement of traffic is managed actively.
In simple terms, there is an obligation to consider car journeys that happen on the local highway network, and to have due respect and consideration for how this traffic moves out into the National Highways Network and vice versa. To do this, it's necessary to consider coordinating street and road works in great detail - to ensure that works don't clash and have too-heavy an impact on the given date range and overlapping works.
This involves having a holistic view of the area so as to be in a position to assess the impact of all the planned and unplanned works in an area, to minimise clashes and disruption. It also involves maximizing the window of opportunity wherever possible, to collaborate.
In 2022 the Highway Code introduced a new hierarchy of road users. The objective of that was to consider - for example - what impact a lorry would have, and to focus on improving the behaviour of motorists. Looking at works, looking at disruption, looking at how to potentially minimise congestion. As part of that process, undue delay must not be caused because it causes emissions and delays to people and the travelling public.
Sam put this in context with a sensitive example: "Within the road works that were in my area, unfortunately there was a fatality in which cyclists were negotiating with a lorry, but not with any success. What's not immediately clear, is that these were utility works using freeway lights. We had actually assessed that wasn't supposed to be the case - it was what we call 'a defect'. The reason for mentioning this, is we have to consider how to improve congestion works in the real world, where things don't always go to plan."
Congestion usually denotes cars, but that's not necessarily the case. Indeed, closing a road or implementing portal traffic lights to provide a walkway for may be overlooked because most stakeholders are, in fact, car centric. This leads to a 'balancing scale' of things to be aware of. A 10-minute inconvenience for a driver, following a diversionary route, or five minutes sitting behind a set of lights, balanced against the lives of children, and loved ones, and being able to safely walk to the shops, find a bus stop, or get to the playing fields. In some ways then, congestion is actually preferential.
Sam moved on to explore permits, which provide additional checks over the previous notices' system. "Work promoters," he said, "can seek to occupy a highway for which the street authority may apply conditions - how the works are undertaken etc - and this means advanced public notification. It involves 'lane rental', which in turn involves consideration of the busiest and most strategic part of our network to minimise disruption where we can."
GeoPlace has supported authorities looking at traffic and street reviews, to understand the distribution of traffic and drill down into what are, potentially, lane rental impacts, and what roads should we be considered, for improvement.
Sam: "In the main, lane rental schemes allow local authorities to charge work promoters for street and road works, so it's both our own works and utility works and others. This means raising a focused charge for occupying the highway at the busiest times. We," he continued, "as a species are naturally lazy. We always want the quickest route. But through modal shift, we could make car journeys less desirable and change society norms. Option A, for example, might be, "Car users take a journey they know is not going to be reliable, as it takes an hour, or even an hour and forty minutes due to congestion. The question arises, do we even add congestion to this situation, to move those car users into a different behaviour? Would walking be quicker?"
Congestion could be used as a tool to aid the modal shift to a selection of a more sustainable modes of transport. Indeed, in some respects, more congestion on short journeys might be the means to reduce demand on the highway network in the future, thus reducing congestion in the future. It may even be possible to create a new societal norm, leaving the car behind to walk, cycle, bus, and train a journey instead, thus reducing congestion and impacts overall."
You can download this write up as a PDF here.